As data visualisation designers we use graphs to make comparisons easier. Therefore, selecting the correct graph is important. Today it is quite common for graphic designers to select the wrong type of graph for their data due to trend, aesthetics etc. Currently bubble charts are quite on trend, however using circles causes us to always underestimate the size difference. Something to consider when selecting a graph type is that our eyes are good at calculating one dimension, however we are not good at calculation surface area (height X weight). Squares are much easier to compare more accurately.
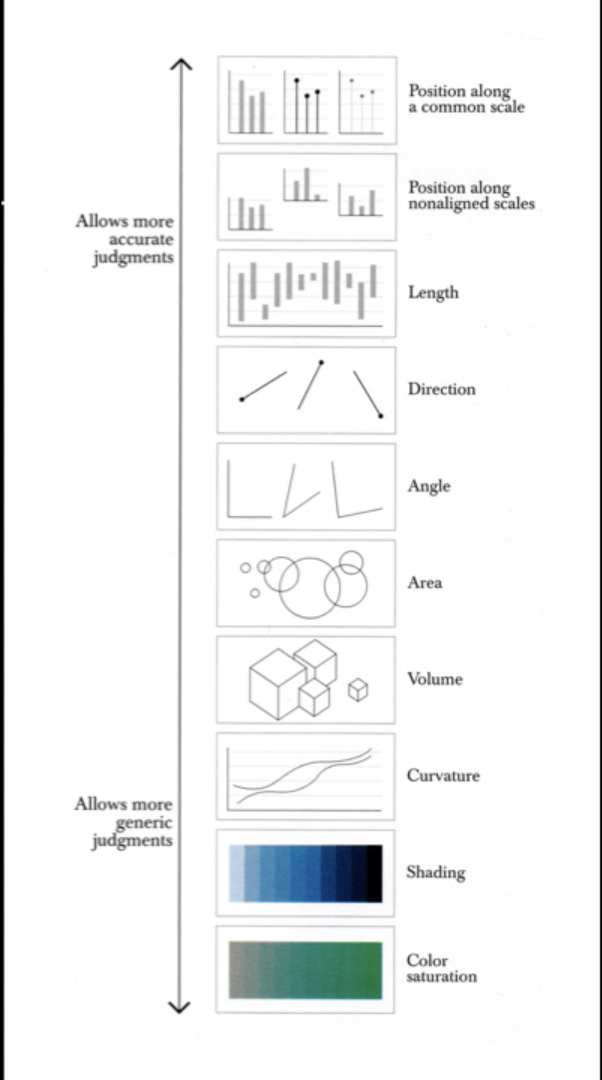
In Albert Cairo’s book, The Functional Art, provides a ranking of graphic approaches to data based on human perception.

Cairo, A. (2013). Why do we use graphs? [Image]. Retrieved 3 September, 2018, from https://vimeo.com/177306425
Something like shading on a map to show height is used as a general indicator. It doesn’t need to be exact it is simply for relative comparisons. However, comparing dollar values using a bar graph is more accurate as it allows instant comparison.
The 3 most common graph types are:
- Time series chart
- Bar chart
- Scatter plot
Some examples of when to use certain charts:
Bar Chart: These graphs are familiar. They are one dimensional and easy to use to compare two things. They are best to use when comparing data across two categories.
Line Chart: This type of graph is used to display trends over time. For example the stock price over a 5 year period.
Pie Chart: This type of graph is used to compare relative proportions or percentages of information. For example the percentage of a budget that has been spent. A handy tip is if your data requires more than 6 pieces of pie, a different graph type would be more appropriate.
Most important aspect and why?
The most important aspect of this lecture was gaining an awareness of the importance of selecting the correct graph type to present your data. I have noticed the trend with bubble charts and have found them quite visually appealing, however hard to interpret. Therefore, it was interesting to hear that these are perhaps not the best graph type to use to present data to allow for accurate comparisons. The reason this was the most important aspect was because data visualisation is a new area of design for me, therefore I tend to think graphically rather than presenting the data in the best way to be understood. It is good to know that simple and familiar graph types, like the bar graph, are often the best form to present your data and that understanding the data is the most important aspect to remember. It was also interesting to learn that the human brain can only compare one dimension and calculating surface area is quite difficult. This is something I will need to keep in mind, again that understanding the data is priority over visual appearance.
Reference
Cmielewski, L. (2016). Data presentation styles: Why use graphs [Video File]. Retrieved from https://vimeo.com/177306425